- Improve entity framework performance
- Optimize queries
- Fix bottlenecks
- Save countless hours


Speed up your app!
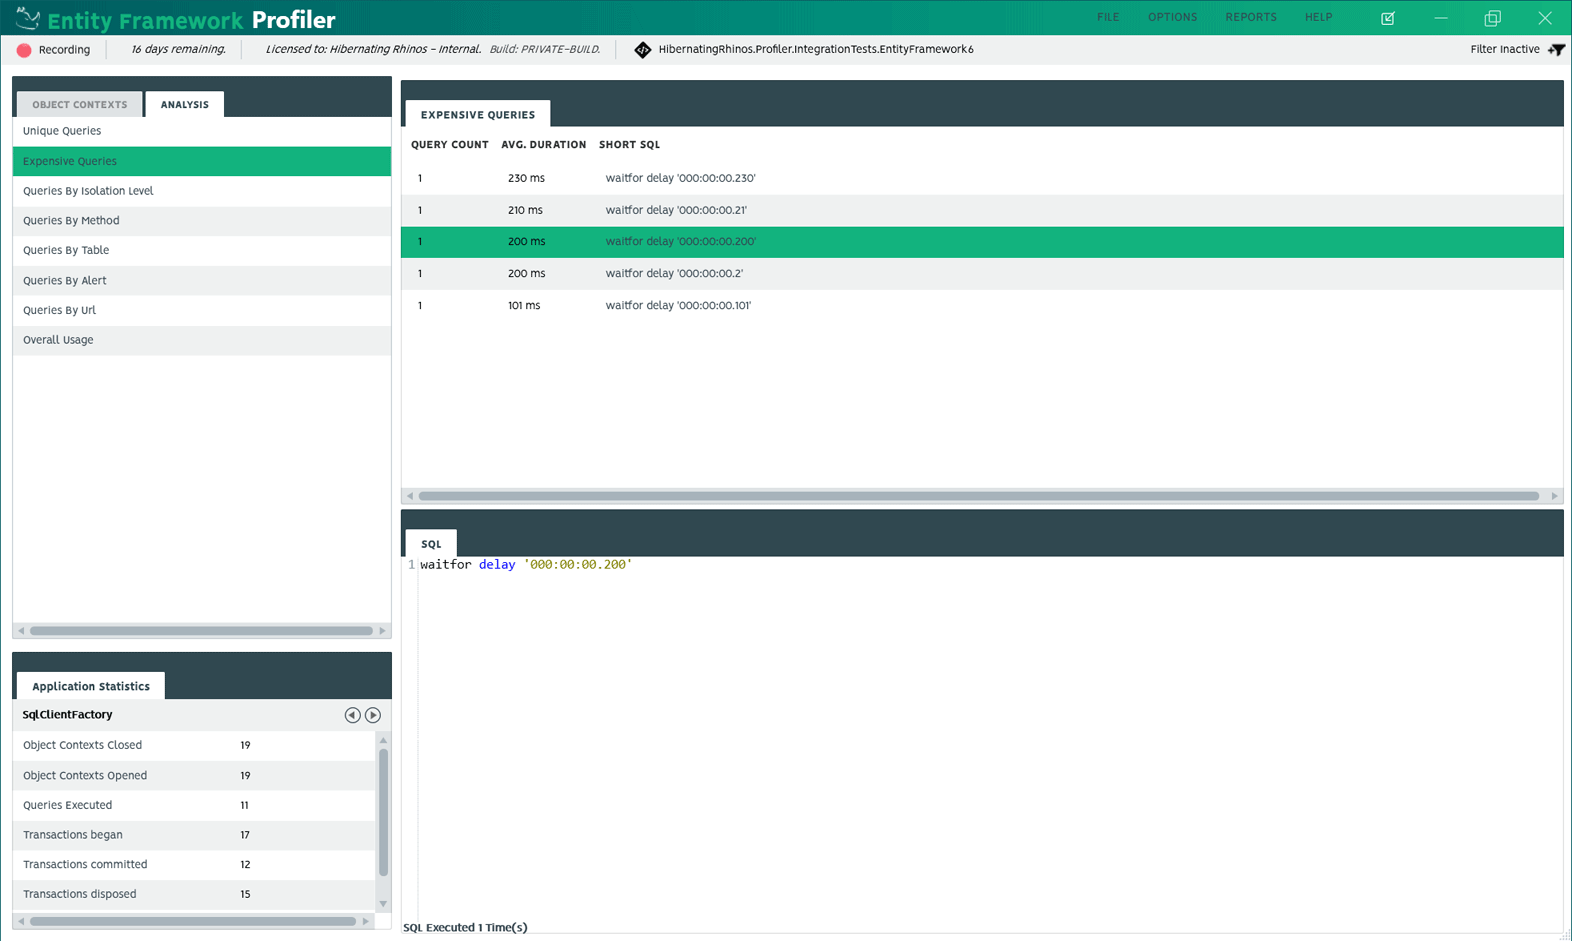
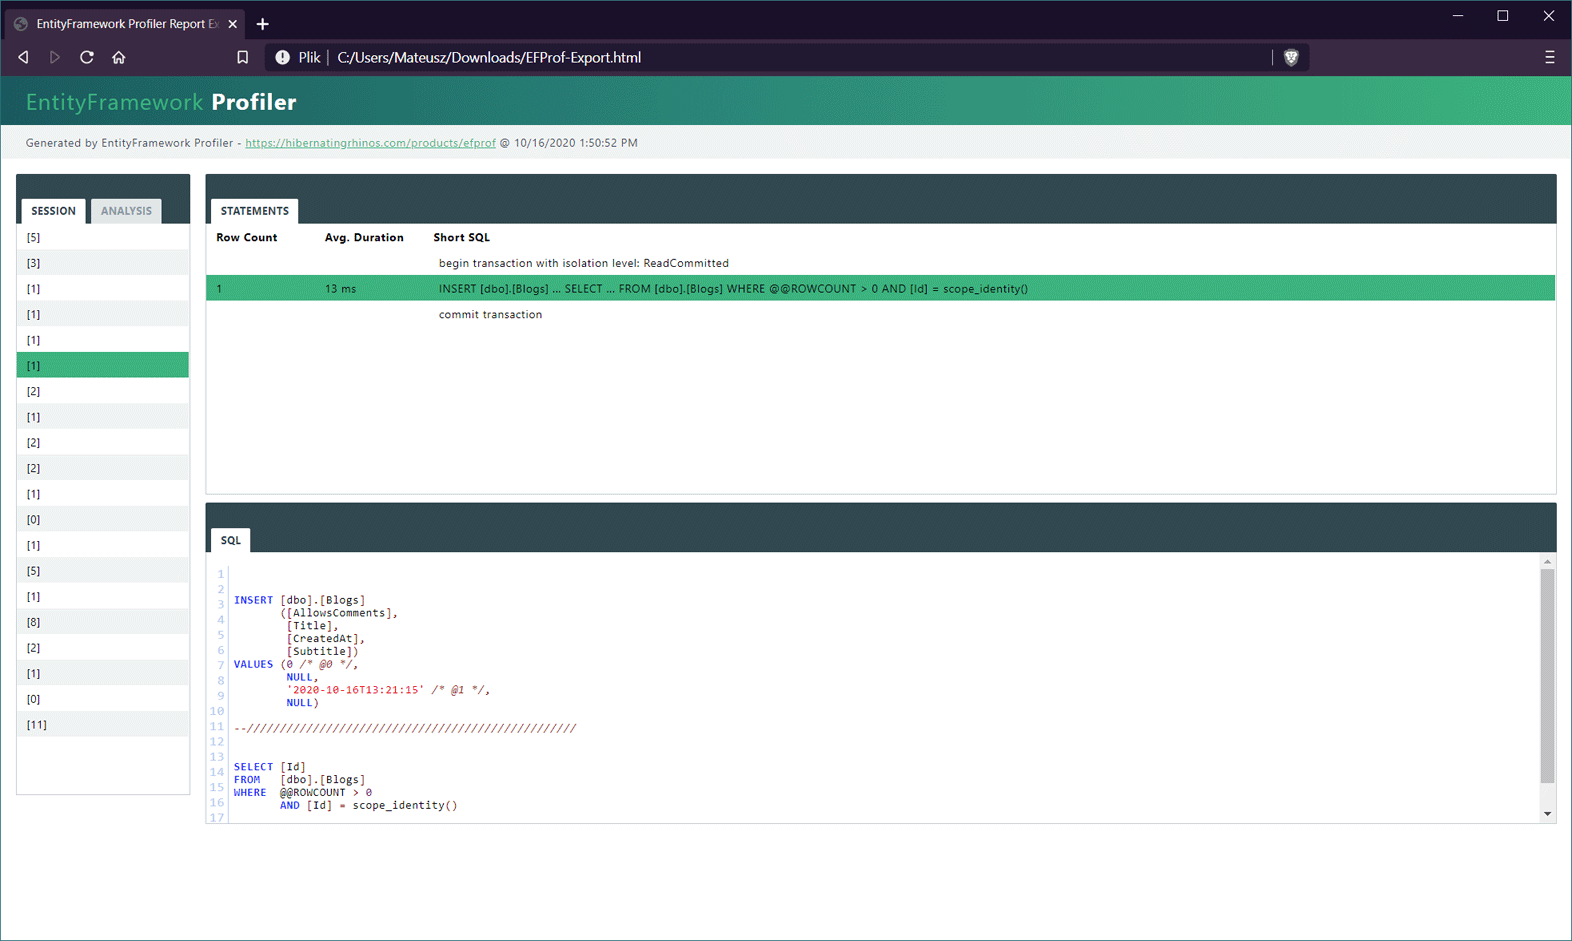
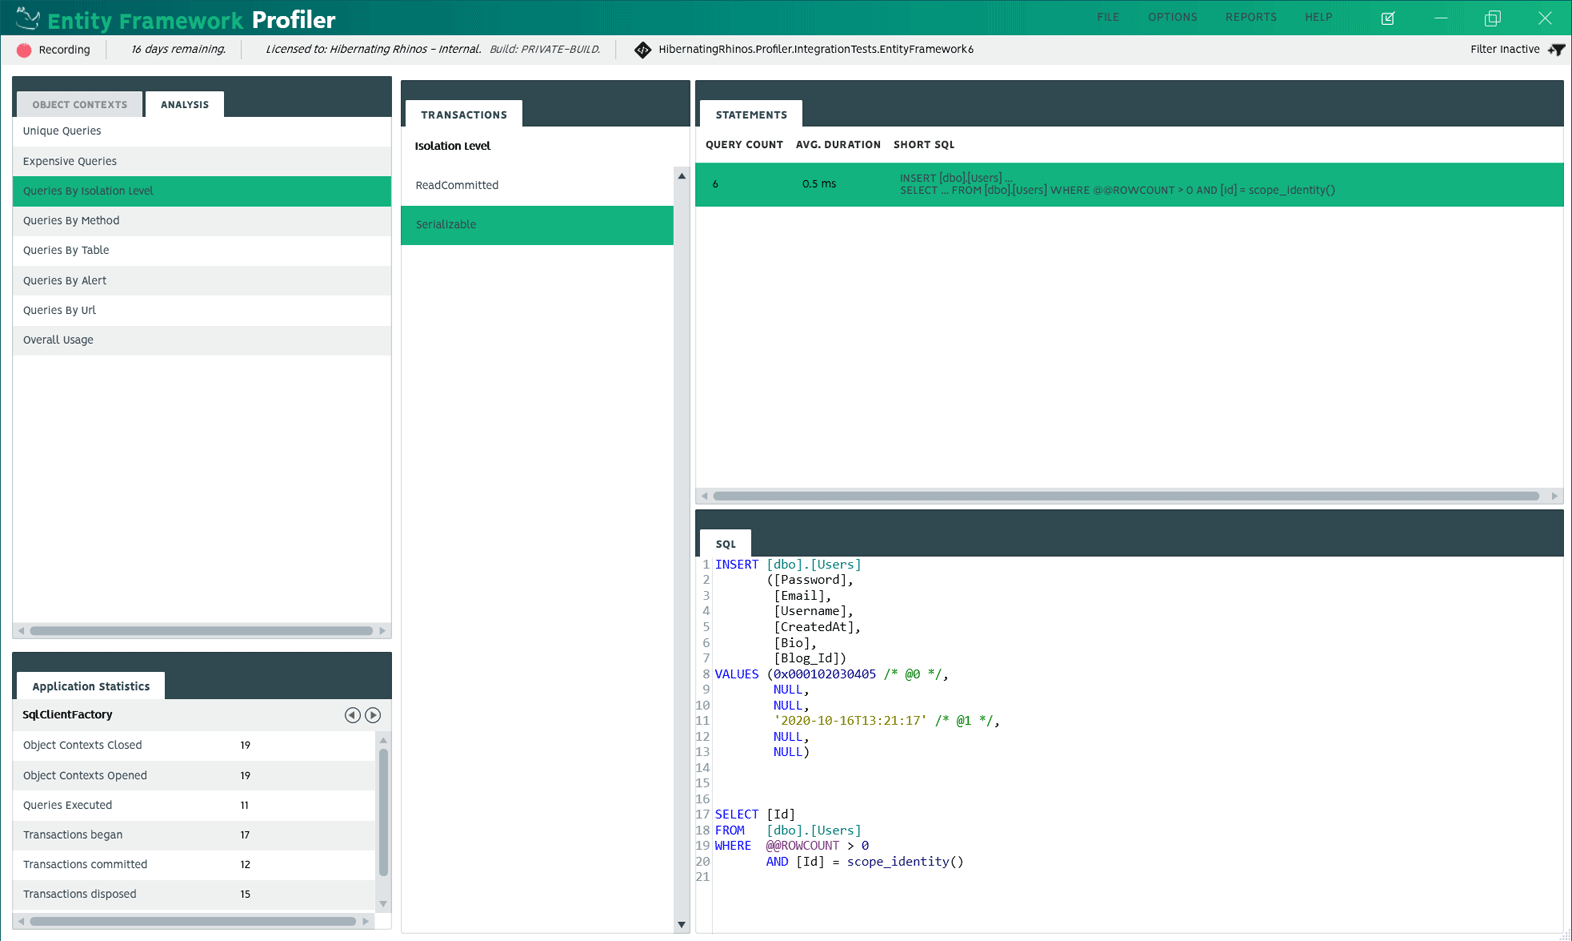
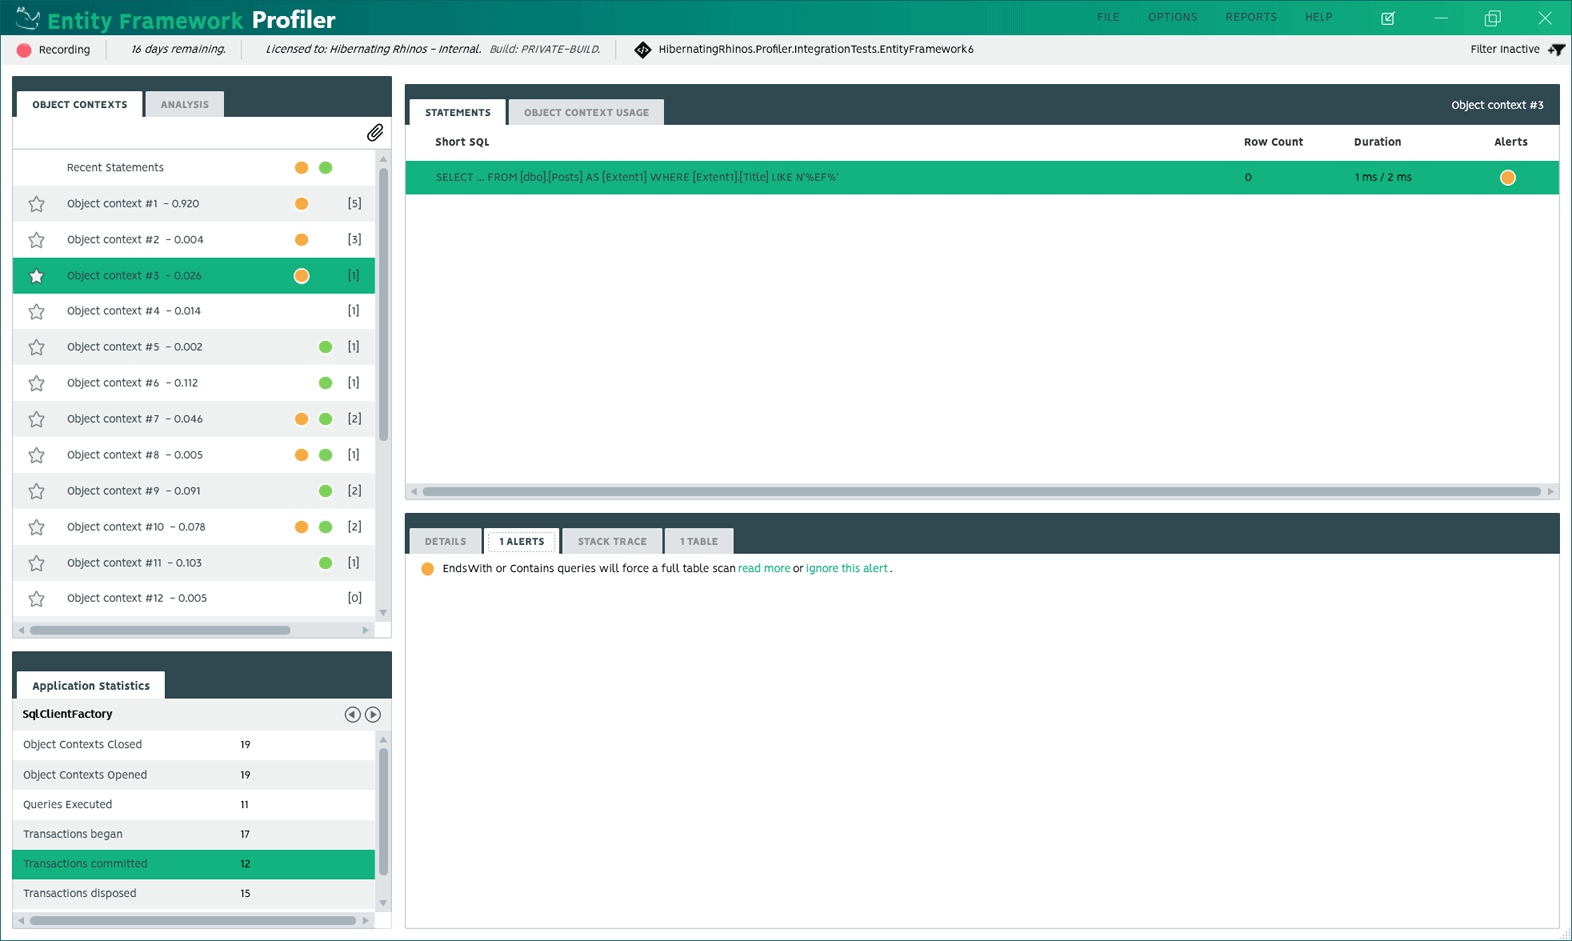
Entity Framework Profiler is a real-time visual debugger allowing a development team to gain valuable insight and perspective into their usage of Entity Framework.
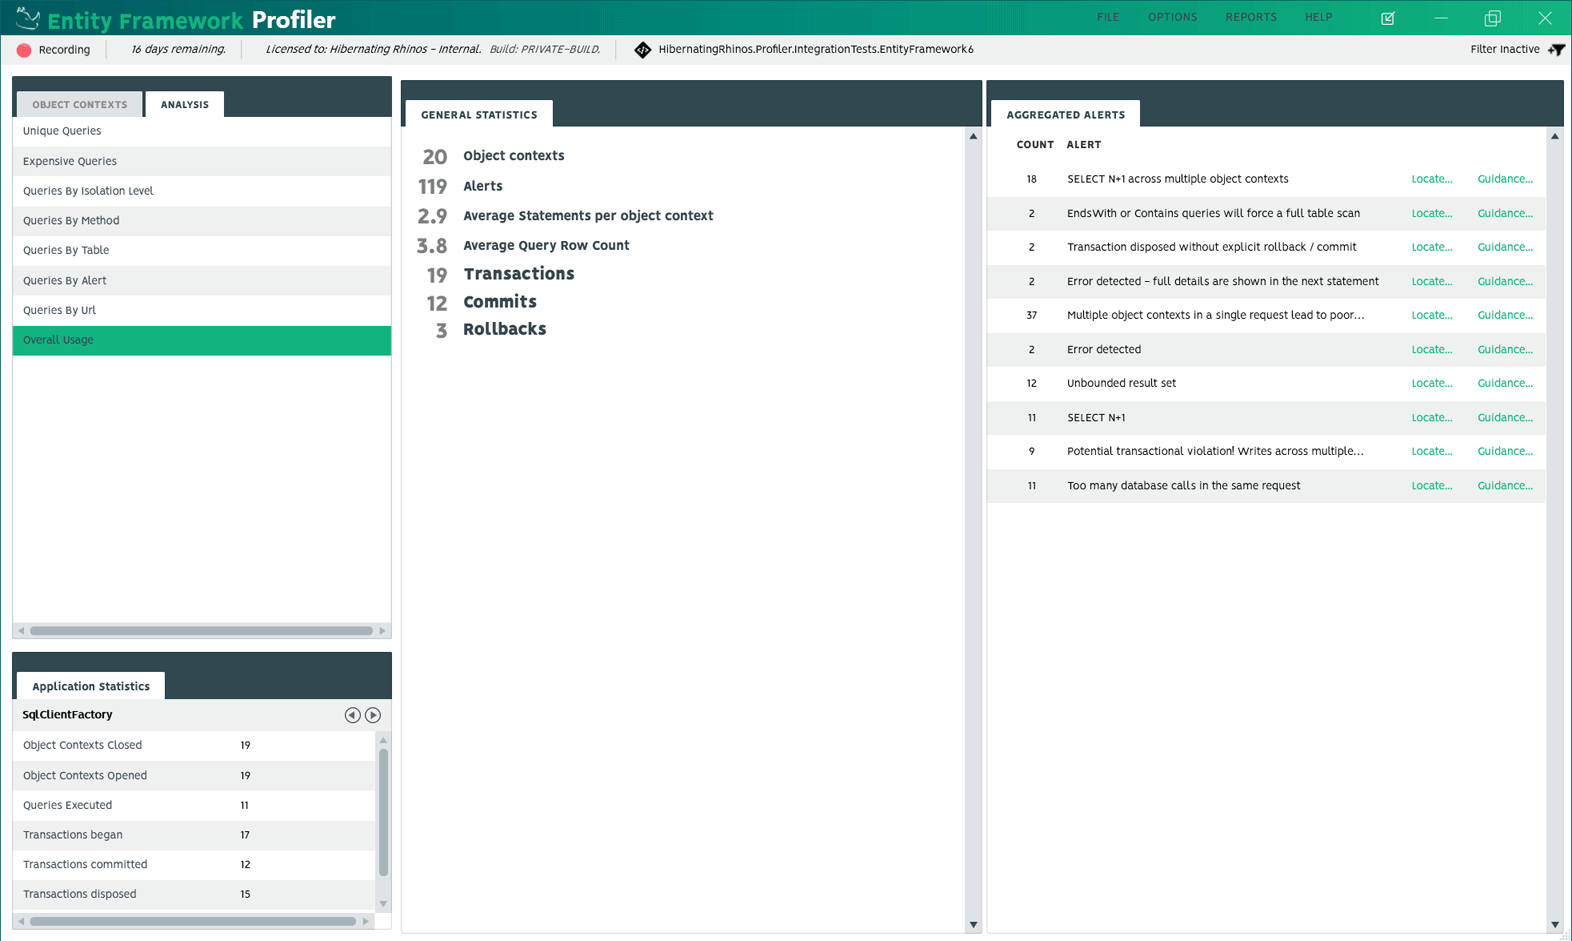
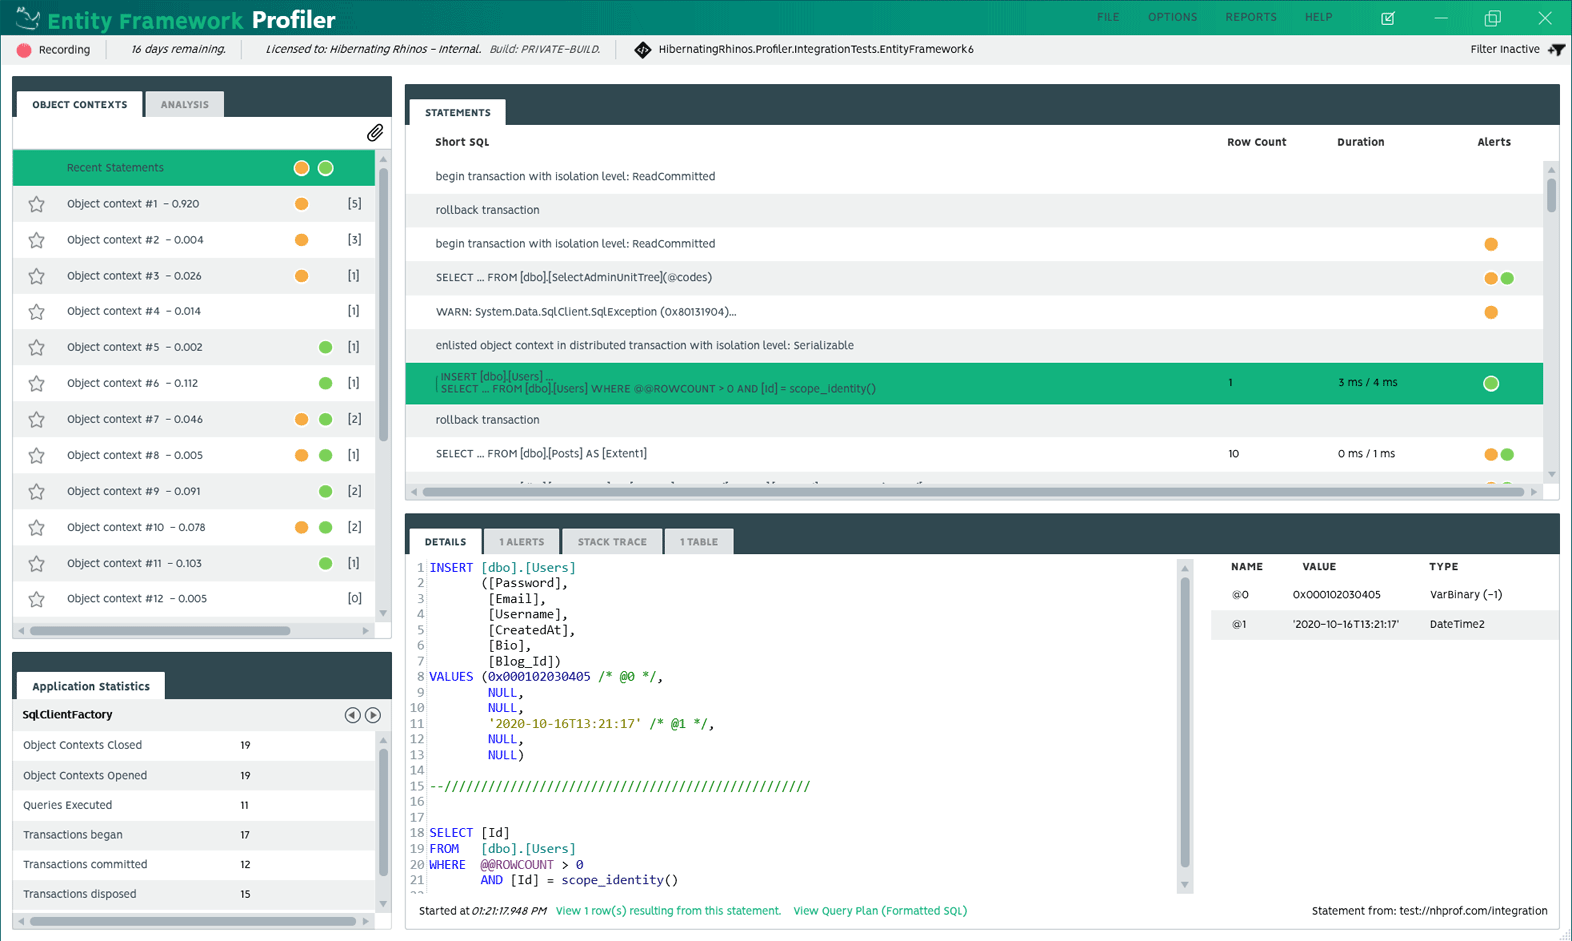
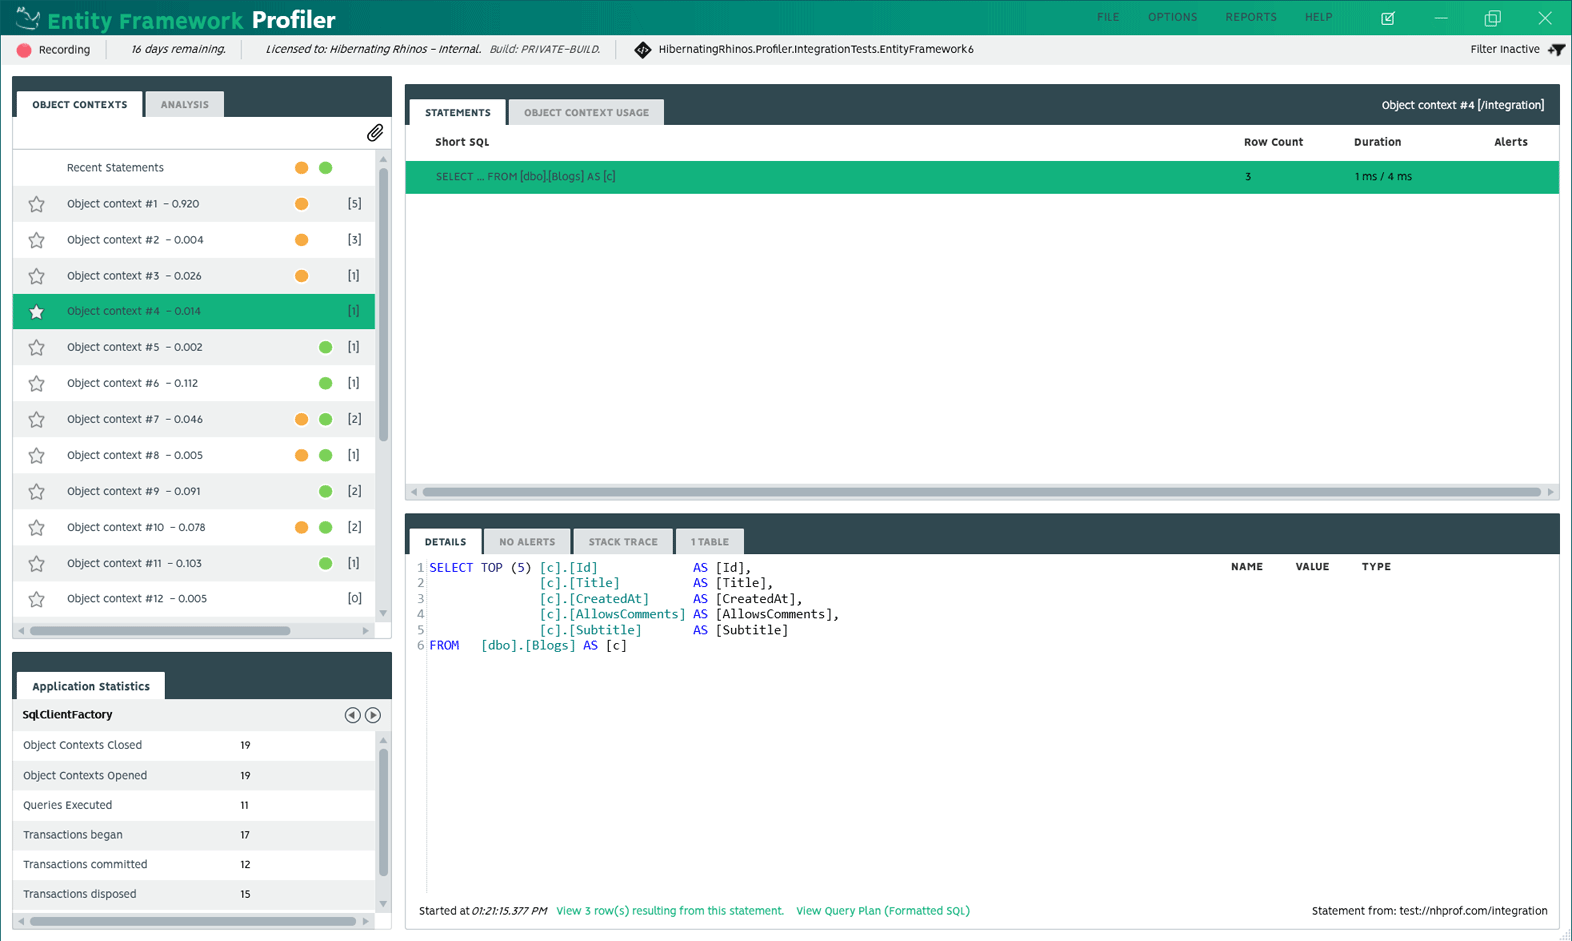
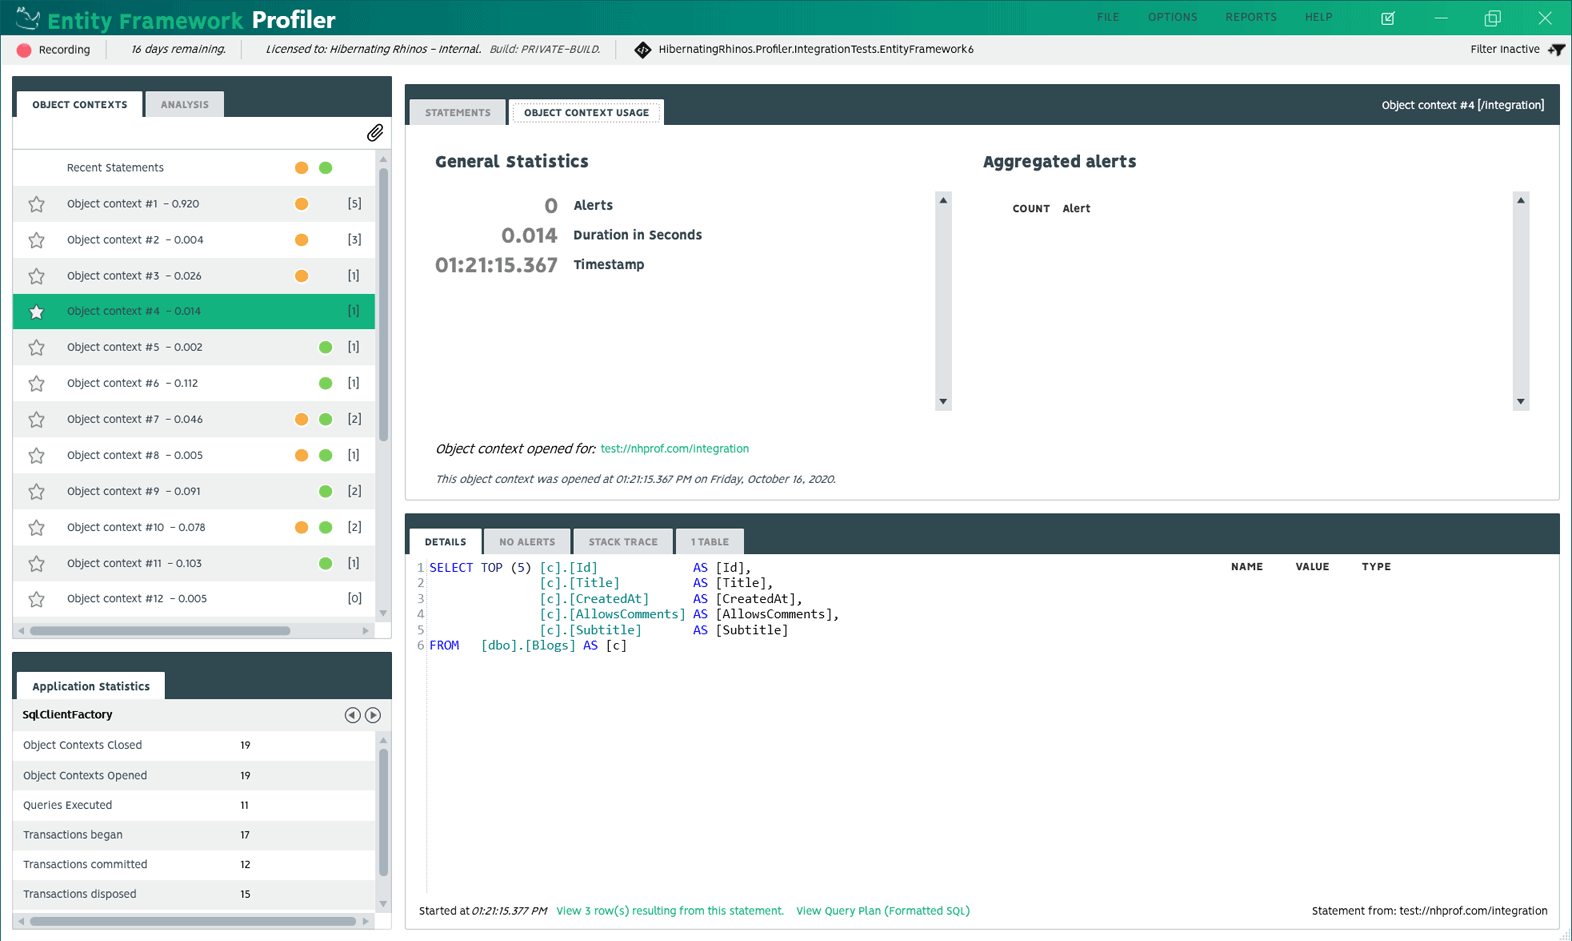
The product is architected with input coming from many top industry leaders within the OR/M community. Alerts are presented in a concise code-review manner indicating patterns of misuse by your application. To streamline your efforts to correct the misuse, we provide links to the problematic code section that triggered the alert.
 Cognitive application awareness.
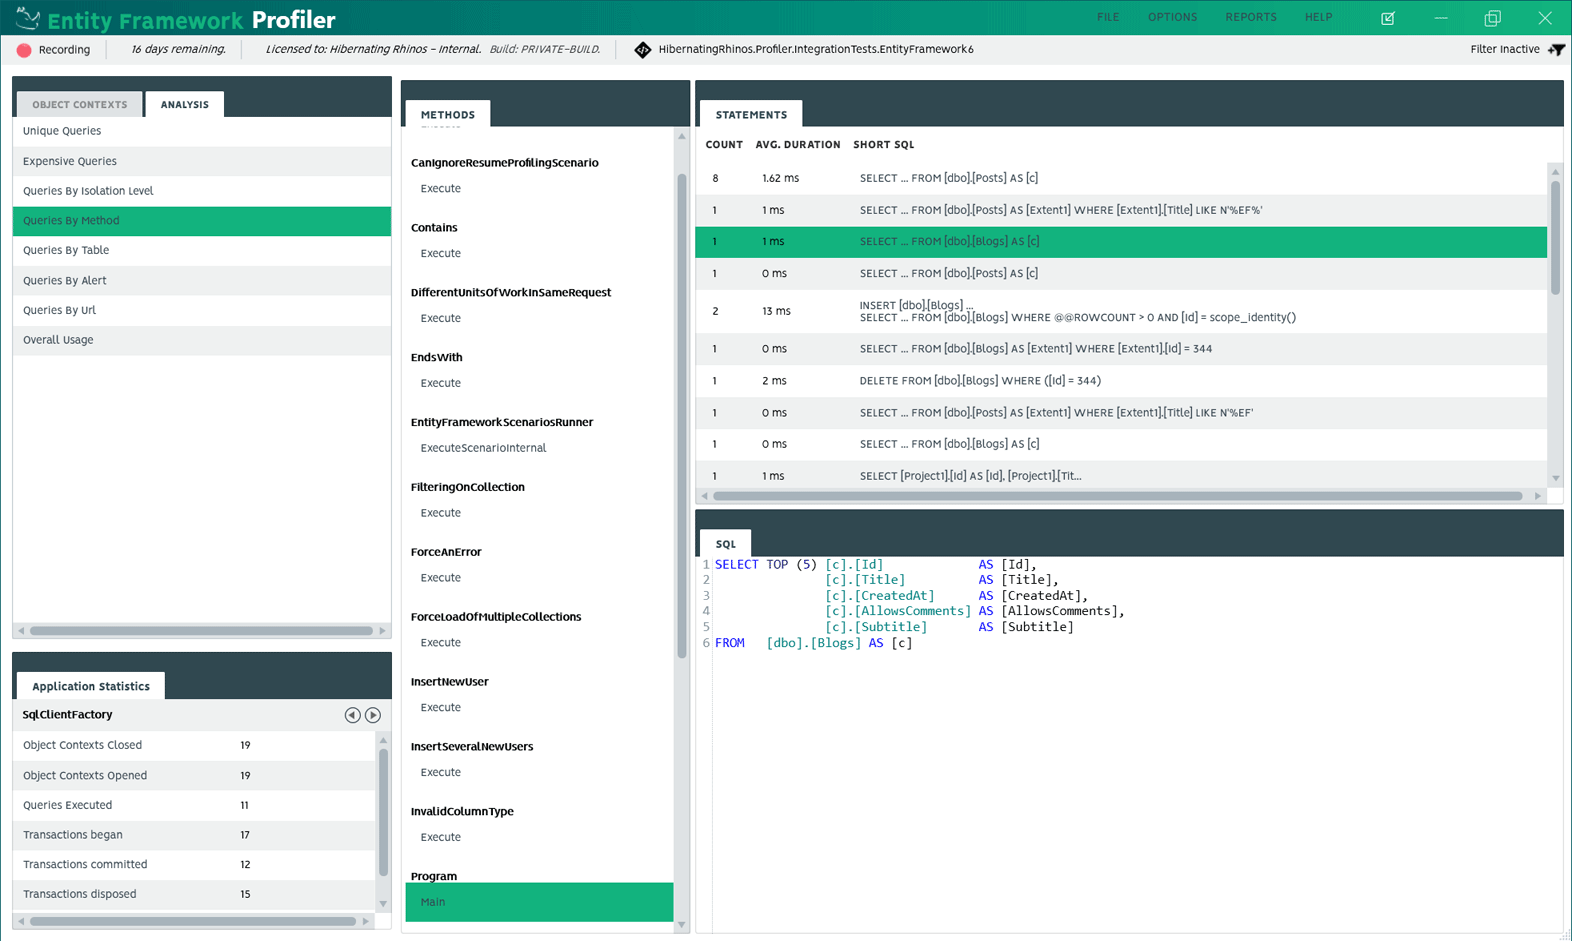
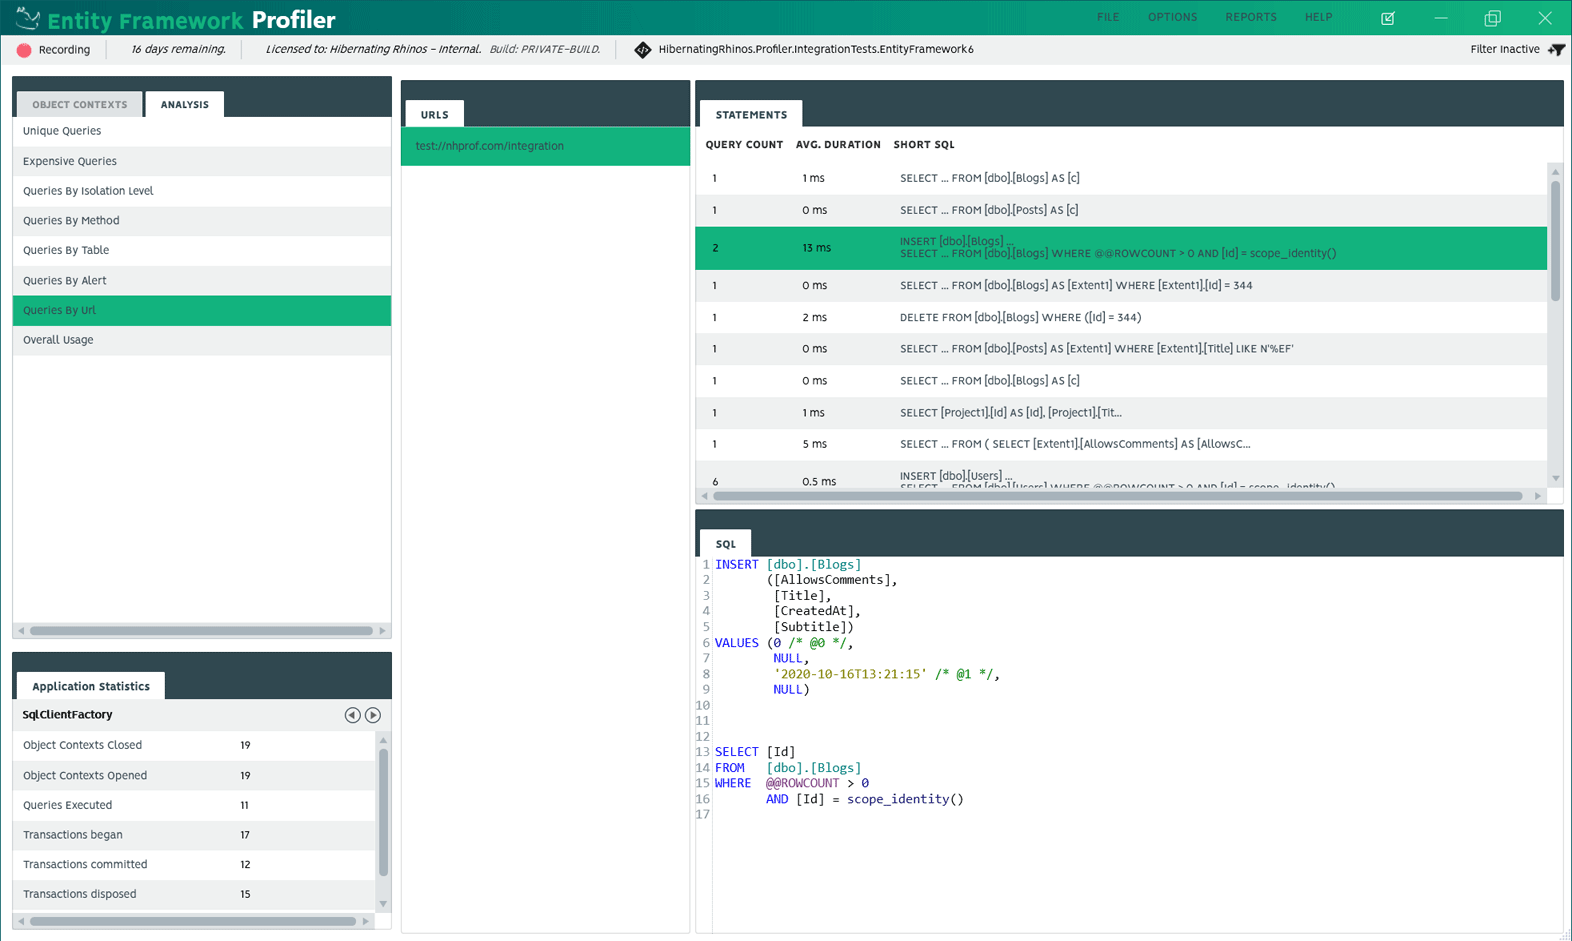
 Visual insight into the interaction between your database and application code.
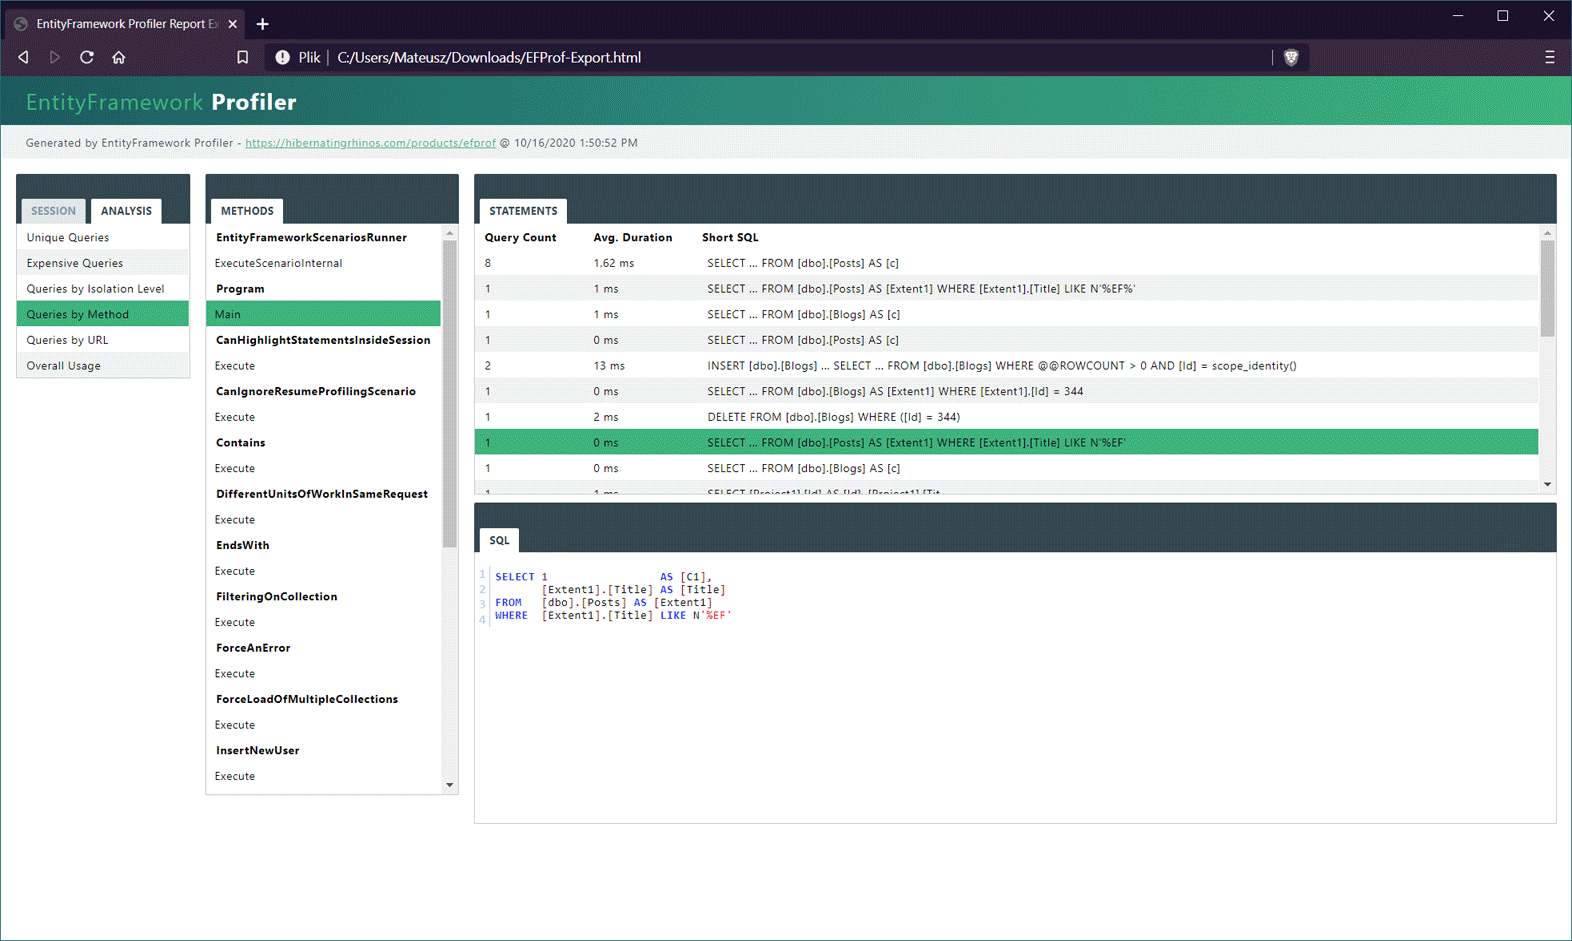
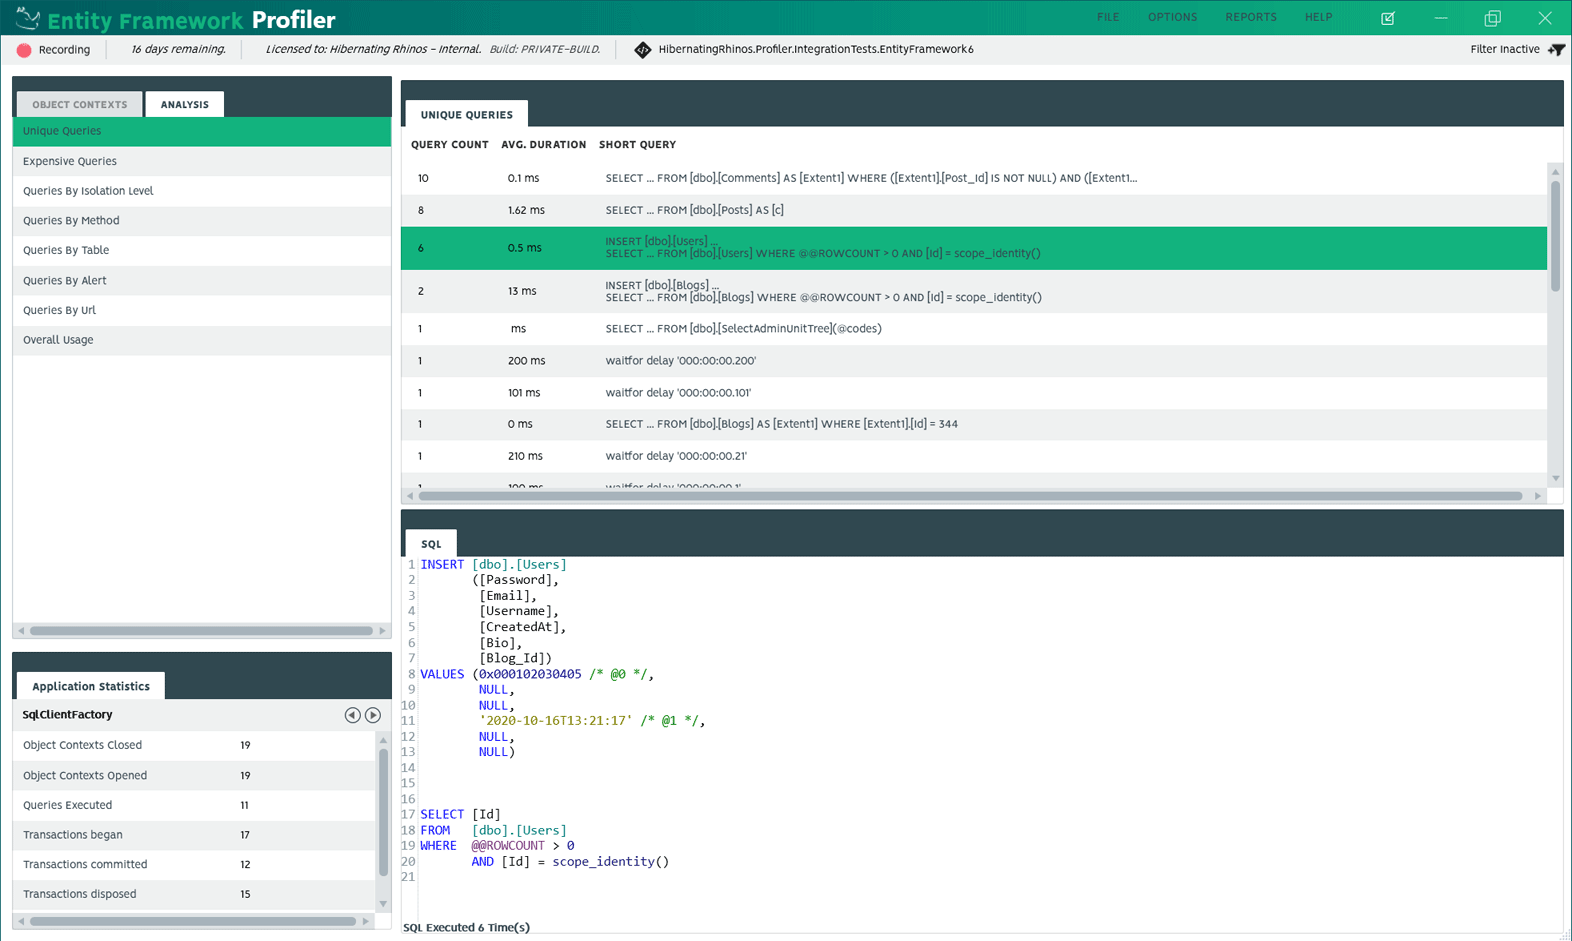
 Analysis and detection of common pitfalls when using Entity Framework.
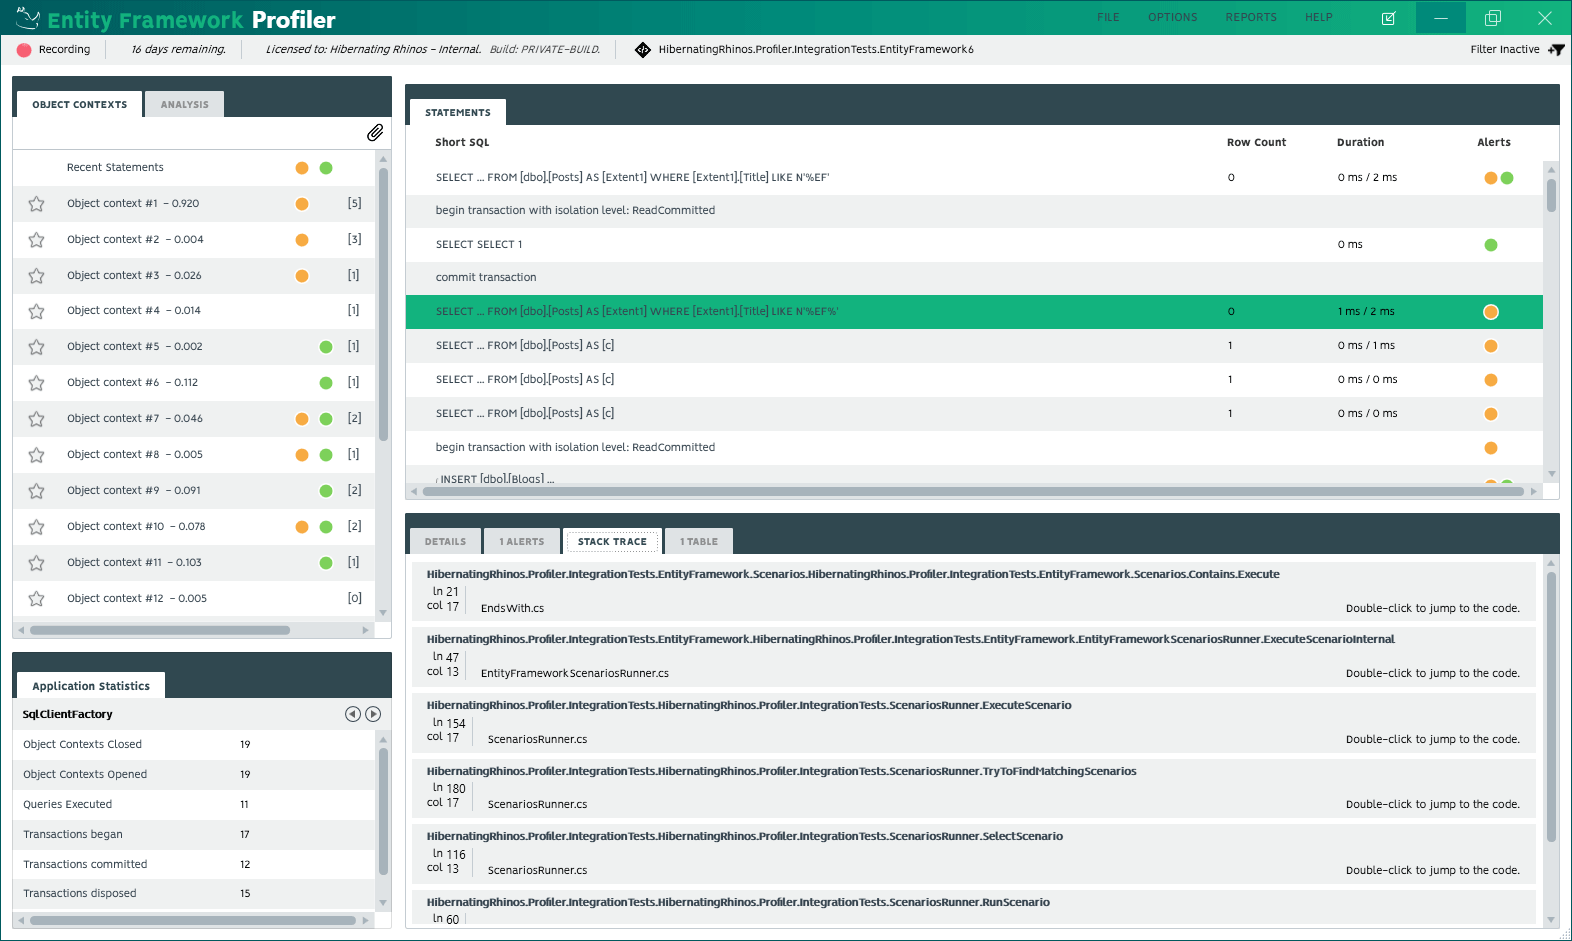
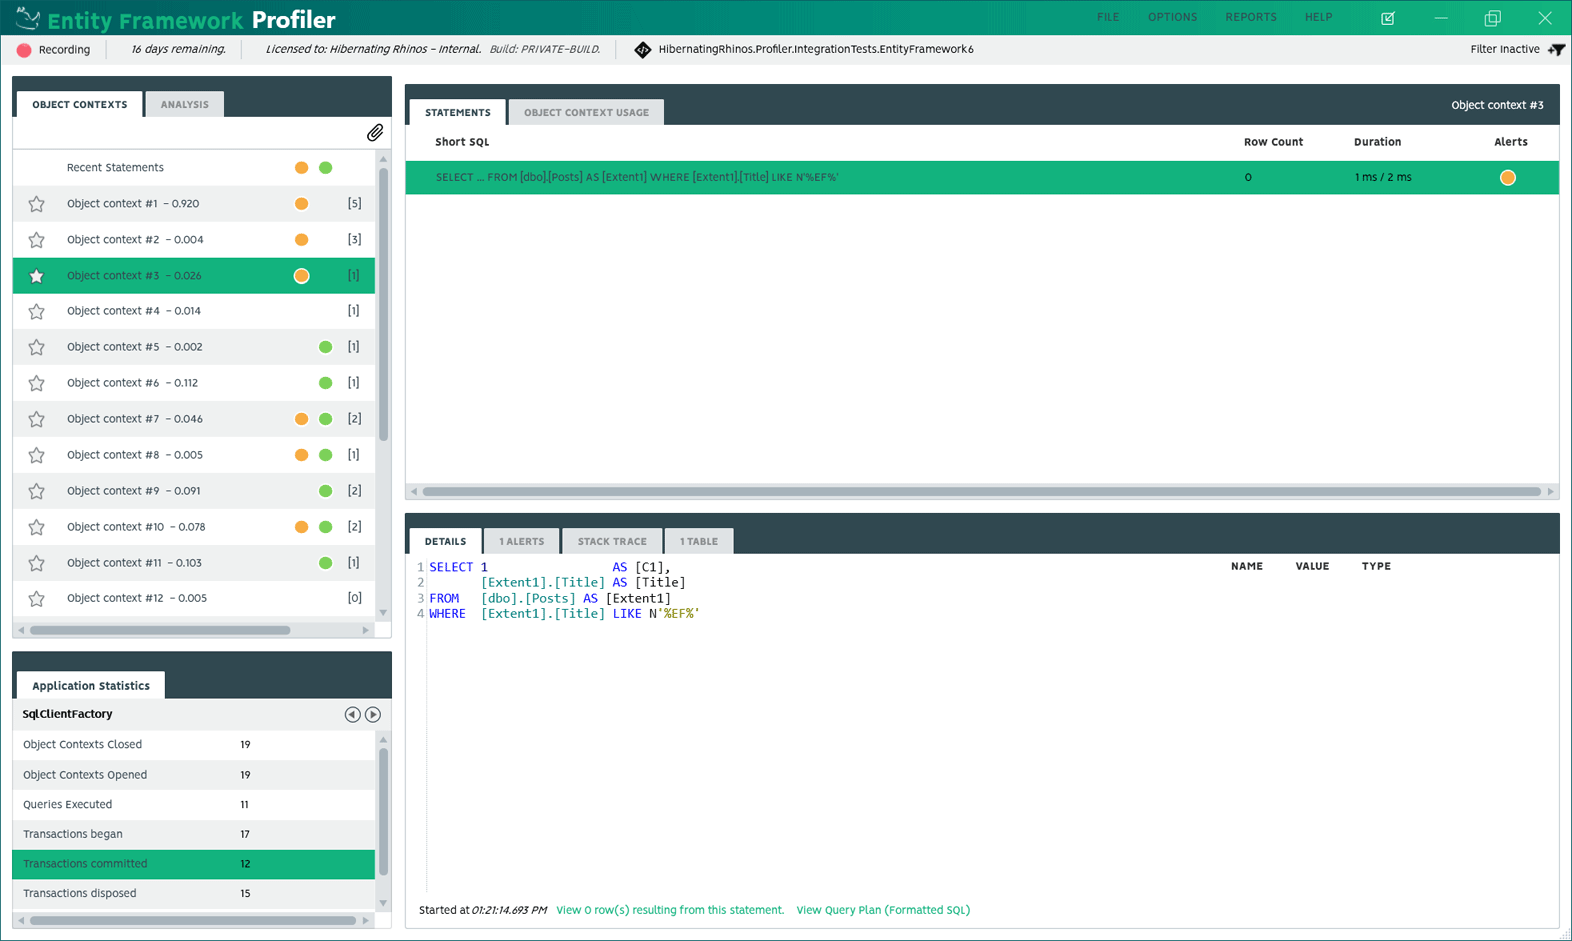
 Analysis is delivered via perfectly styled SQL and linkable code execution.
New in 6.0
New UI
Improved Performance
Async / await support
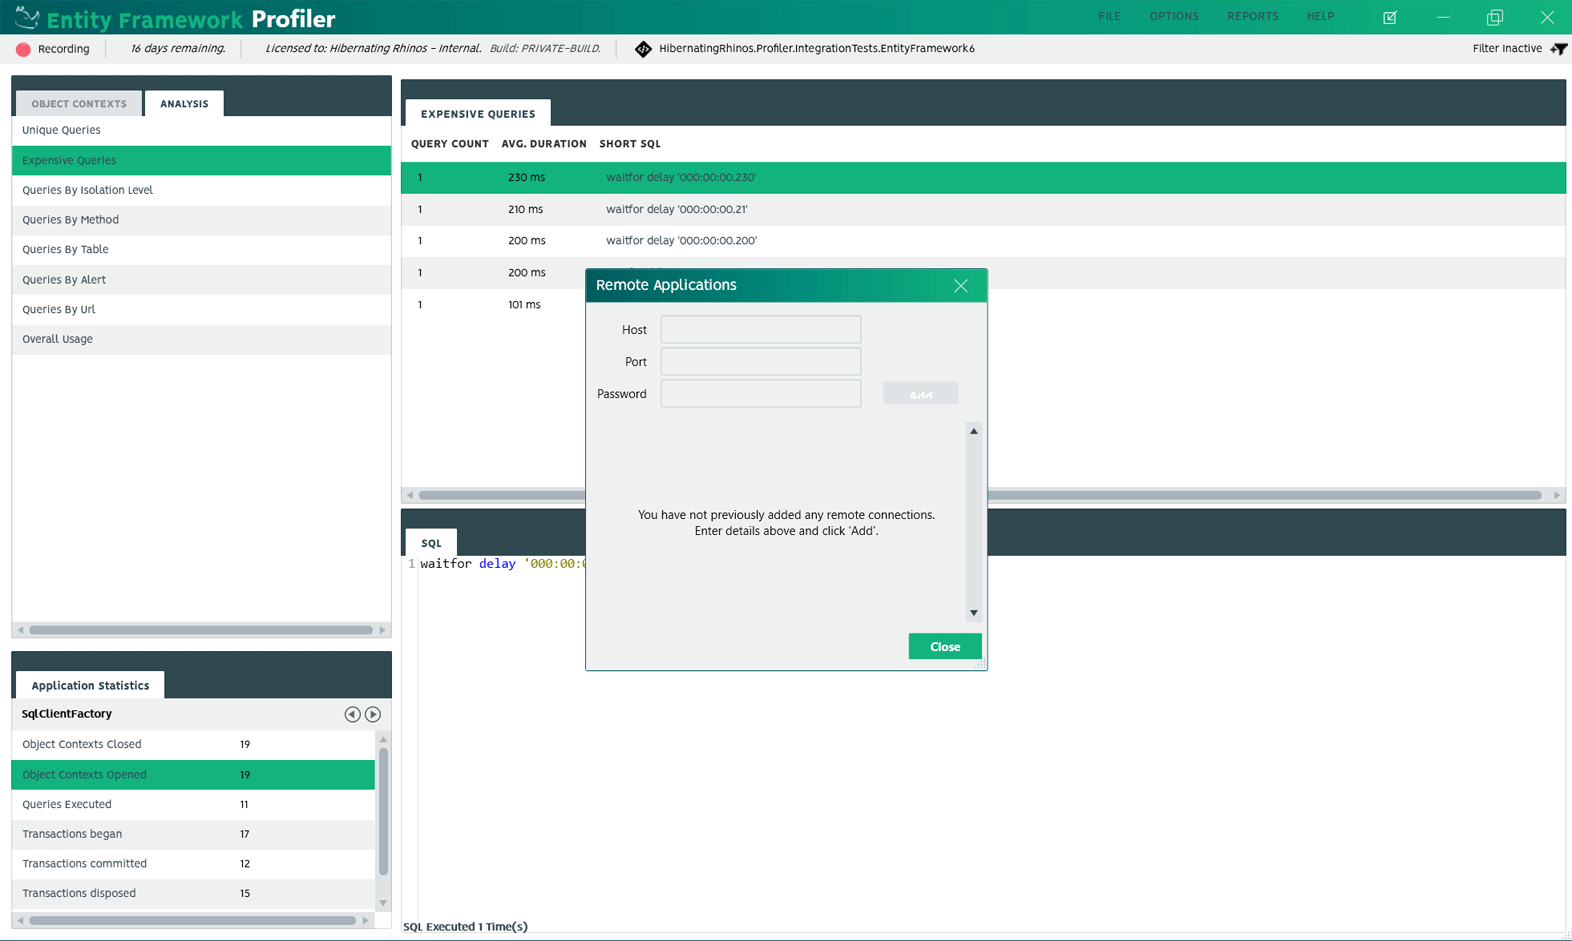
Full .NET Core support
(EF6.3+ / EF Core)
Azure Profiling Integration